

[ad_1]
Gold, XAU/USD, Silver, XAG/USD – Technical Outlook:
- Gold is attempting to break below key support.
- Silver is looking for direction after the rally this month.
- What is the outlook and what are the key levels to watch for a change in trend?
Recommended by DailyFX
Get Your Free Gold Forecast
GOLD TECHNICAL FORECAST – BEARISH
Spot gold is testing crucial technical support, a break below which could point to further weakness in coming months. It is attempting to break below key horizontal trendline support at 1,676, coinciding with the 200-week moving average. Although it closed below the support on Thursday, given the significance of the support and the number of times it has been tested since 2021, it might be prudent to wait for two weekly closes below the support before concluding Thursday’s move as a valid break.
A decisive break of the four-year moving average could have implications not just for a few days, but potentially weeks/months. In terms of levels, a fall below the horizontal trendline would trigger a double top pattern (2020 and 2022 highs), pointing to a potential fall towards the 200-month moving average (now at about 1292). Still, there is quite strong support at 1,620 (the 50% retracement of the 2018-2020 rise), followed by 1510 (the 61.8% retracement).
To be fair, the bearish break is not a done deal yet. There is an outside chance that Thursday’s move was a false break, triggered by position adjustments ahead the crucial meeting of the US Federal Reserve’s rate-setting FOMC committee next week. Silver experienced a similar false break earlier this month. The first sign that the break in gold was a false one would be recouping Thursday’s losses to close above 1,676, leading to an increase in the probability of a move towards the September 12 high at 1,735. A break above 1735 would then likely change the bias from bearish to favoring range-trading conditions in the interim.
Recommended by DailyFX
How to Trade Gold
XAU/USD Weekly Chart
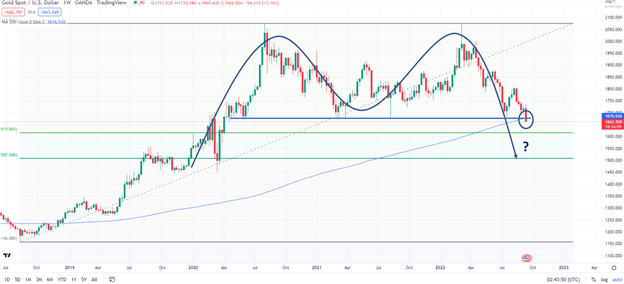
Chart Created Using TradingView
SILVER TECHNICAL FORECAST – NEUTRAL
The failure to sustain losses following the break earlier this month below key technical support, coupled with positive divergence on the daily and weekly charts, suggests silver could be settling in a range in the near term.
In the week ended September 2, silver closed below support at the July low of 18.11. However, even though price made a new low, the Relative Strength Index (RSI), a measure of momentum, failed to follow suit. A fresh low in price associated with poor momentum often suggests that bears lack strength, raising the prospect of a false break.
Similarly, on the daily chart, even though silver made a new price low on September 1, RSI made a ‘higher low’, termed as positive divergence (with price). In the following week, silver was able to recoup the previous week’s loss and subsequently rise above minor resistance at the late-August high of 19.40. For range-trading conditions to turn bullish, silver would need to rise above the resistance area, including the 200-week moving average, the horizontal trendline at 21.40 and the August high of 20.86. On the downside, a decisive break below the September 1 low of 17.53 would be a sign that silver had resumed its medium-term downtrend.
Recommended by DailyFX
Get Your Free Top Trading Opportunities Forecast
XAG/USD Daily Chart
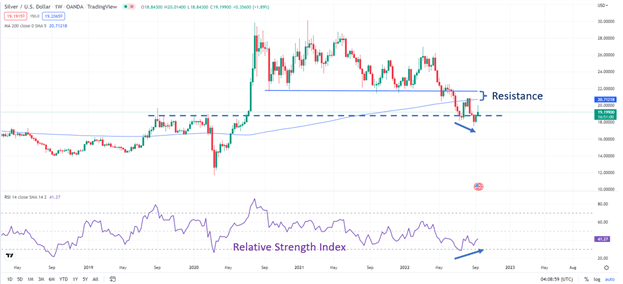
Chart Created Using TradingView
–— Written by Manish Jaradi, Strategist for DailyFX.com
[ad_2]
Source link


