

[ad_1]
XAU/USD (Gold)
The yellow metal kicked off the week in negative territory, down 0.6% heading into the afternoon session in the US.
For those who read Monday’s Weekly Market Insight, you may recall the following (italics):
It is all about the H1 Quasimodo resistance-turned-support at $1,857 and the 50-day simple moving average on the daily timeframe at $1,856 this week. Clearance of the H1 level and the daily chart’s 50-day simple moving average throws light on a bearish scenario towards daily support at $1,828 (accompanied by a 38.2% Fibonacci retracement ratio).
As evident from both the daily and H1 charts, the clearance of the 50-day simple moving average and the H1 support from $1,857 (now a marked resistance) unshackles downside to H1 Quasimodo support at $1,827, a level lining up with a 1.272% Fibonacci projection (alternate AB=CD pattern) at $1,824 and, of course, the daily support level mentioned above at $1,828.
The Relative Strength Index (RSI) reaffirms the bearish vibe, which recently responded to overbought conditions (70.00) on the weekly and daily charts. The latter also travelled south of the 50.00 centreline (informs market participants that average losses now exceed average gains [negative momentum]) and points the headlights in the direction of oversold territory (30.00). While the trend is still technically higher on the daily chart, price crossing under the 50-day simple moving average helps corroborate the recent softness and, as noted above, exposes daily support from $1,828. Therefore, the test for this market remains at $1,828.
Direction:
In light of the H1 support breach at $1,857 and the 50-day simple moving average on the daily timeframe poised to give way, chart studies suggest sellers are likely to remain in the driving seat, targeting daily support from $1,828, followed by weekly support coming in at $1,807. Beyond here, the precious metal could aim as far south as the daily chart’s pattern profit objective (derived from a daily bearish flag between $1,881 and $1,862) from $1,768.
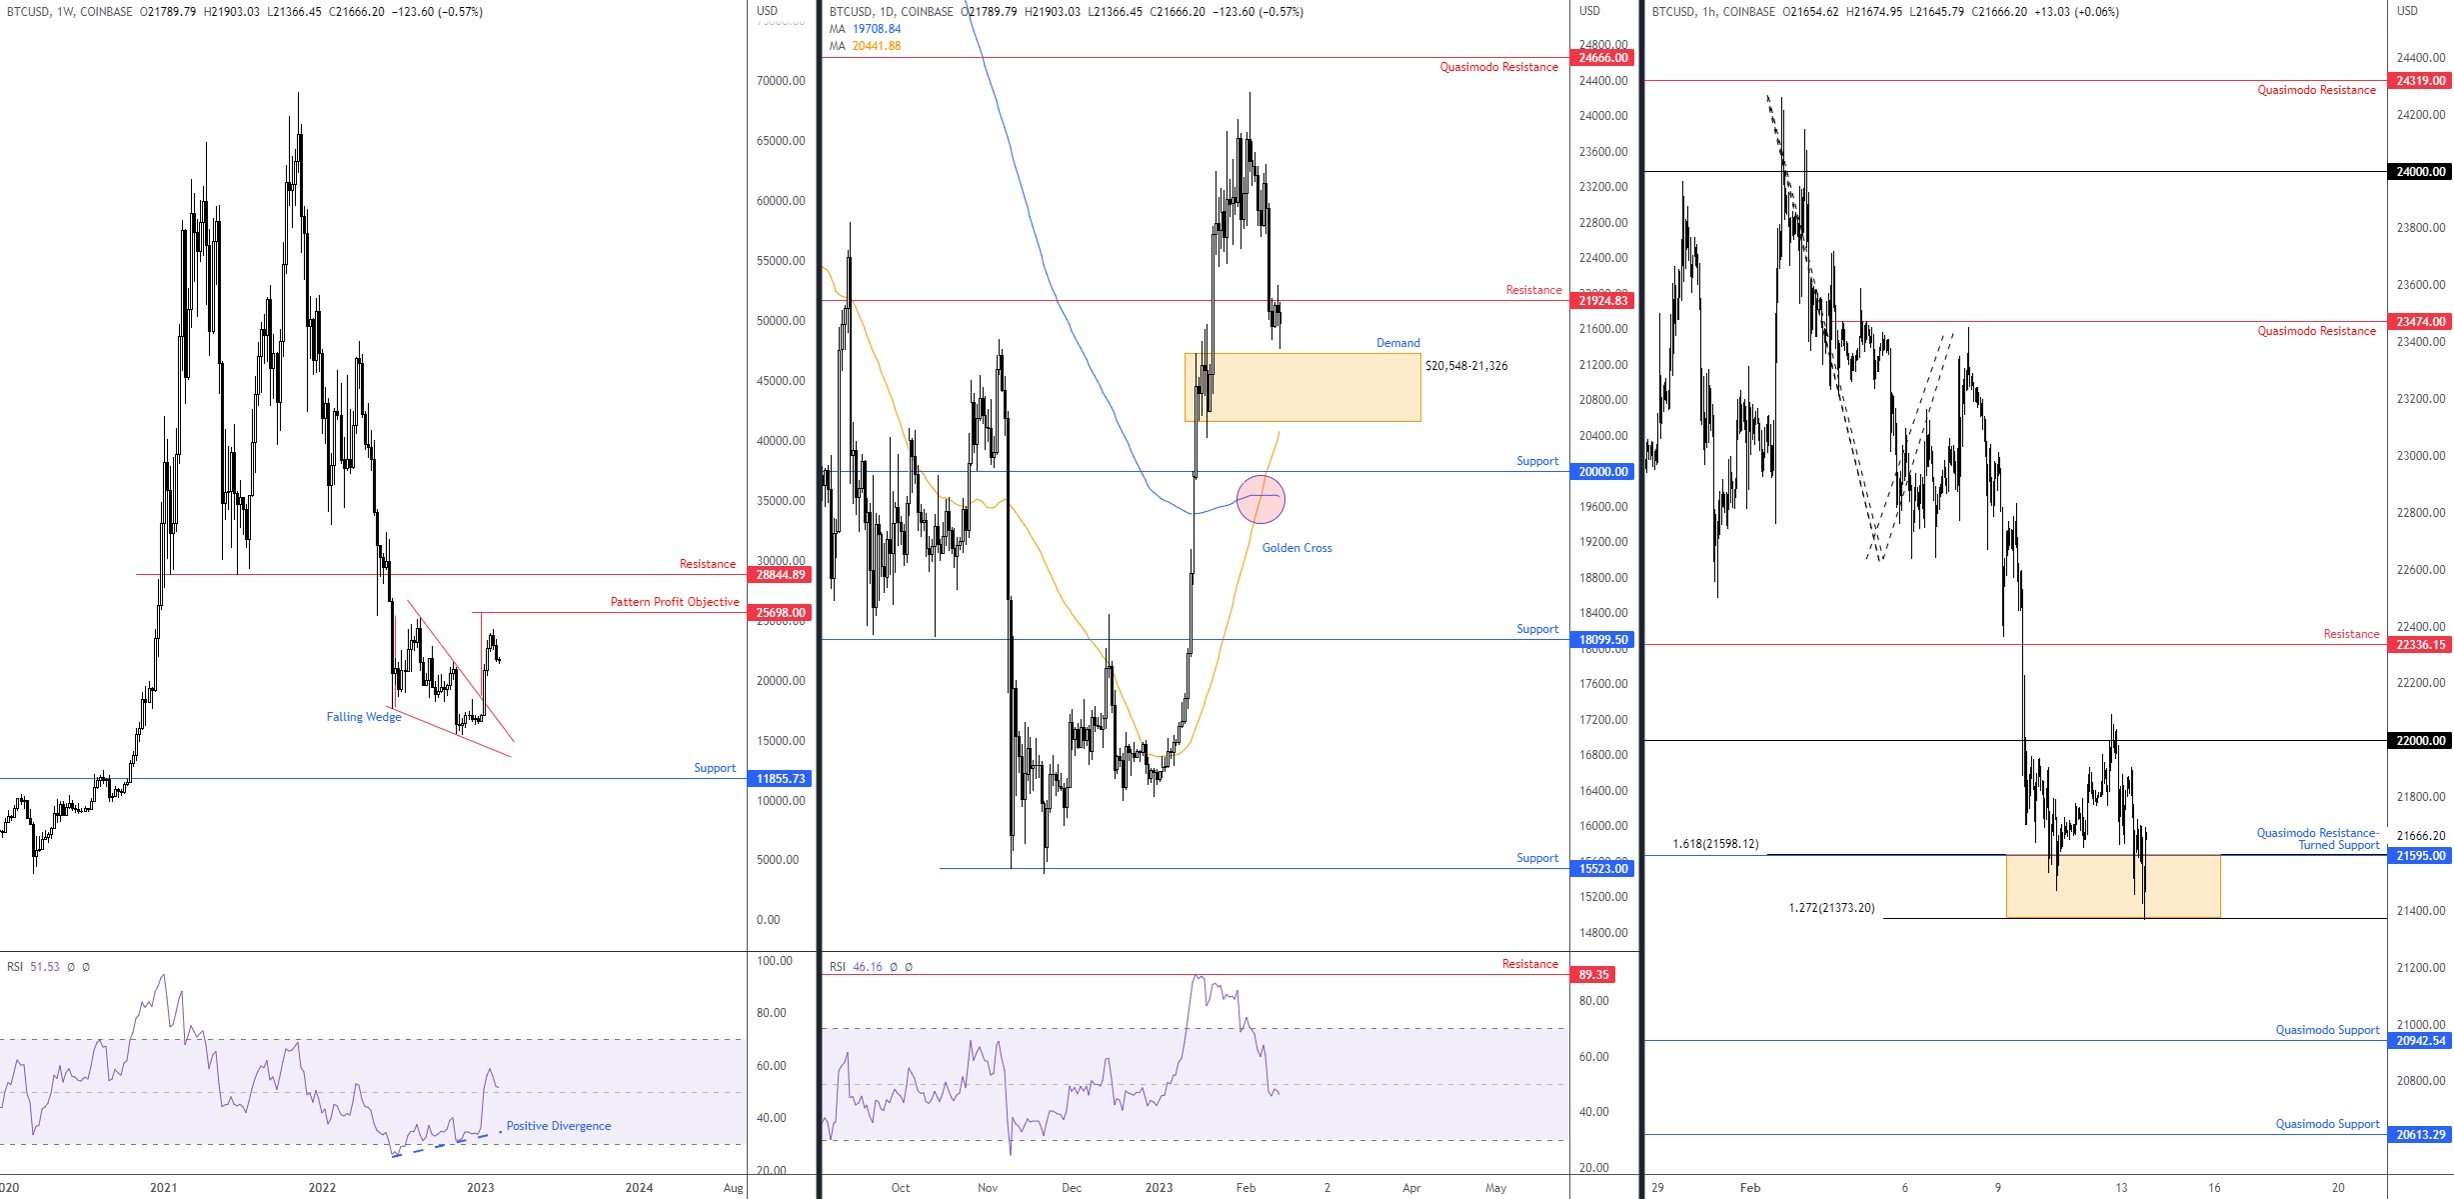
BTC/USD
Following a retest at resistance from $21,924 (and the $22,000 psychological level on the H1 scale) on the daily chart on Sunday, Monday welcomed sellers. As you can see, this led price deep into the walls of a H1 support area between $21,373 and $21,598, made up of a 1.618% Fibonacci expansion, a 1.272% Fibonacci projection and a Quasimodo resistance-turned-support. Dethroning this area paves the way for a demand test on the daily timeframe at $20,548-21,326. This daily demand could be enough to entice dip buyers into the market in anticipation of a continuation of the uptrend on the daily scale.
I noted the following in recent writing regarding trend direction on the weekly and daily timeframes (italics):
Trend direction on the bigger picture is currently offering conflicting opinions. The weekly timeframe remains in favour of sellers—yet to show a higher low and subsequent higher high to transition to an uptrend. On the other hand, the daily timeframe is considered trending higher, and last week’s correction may be just that: a correction within the uptrend which opens the door for dip-buying opportunities. Supporting the current uptrend, of course, is the Golden Cross that was established last week: the 50-day simple moving average at $20,438 venturing above the 200-day simple moving average at $19,724.
Direction:
With the H1 support zone between $21,373 and $21,598 holding by a thread at the moment and demand on the daily timeframe from $20,548-21,326 calling for attention, sellers are likely to remain at the wheel with buyers to perhaps take the reins within the daily zone.
However, as I noted in the Weekly Market Insight, given the weekly timeframe’s bearish trend and the daily RSI taking on space below 50.00, conservative buyers will likely seek additional confirmation before pulling the trigger within the daily demand: either a rebound from $20,548-21,326 to form a price close back above daily resistance at $21,924 or shorter-term traders may drill down to the H1 timeframe and seek bullish setups from Quasimodo supports seen at $20,613 and $20,942, both of which are located within the walls of daily demand.
Charts: TradingView
Disclaimer: The information contained in this material is intended for general advice only. It does not take into account your investment objectives, financial situation or particular needs. FP Markets has made every effort to ensure the accuracy of the information as at the date of publication. FP Markets does not give any warranty or representation as to the material. Examples included in this material are for illustrative purposes only. To the extent permitted by law, FP Markets and its employees shall not be liable for any loss or damage arising in any way (including by way of negligence) from or in connection with any information provided in or omitted from this material. Features of the FP Markets products including applicable fees and charges are outlined in the Product Disclosure Statements available from FP Markets website, www.fpmarkets.com and should be considered before deciding to deal in those products. Derivatives can be risky; losses can exceed your initial payment. FP Markets recommends that you seek independent advice. First Prudential Markets Pty Ltd trading as FP Markets ABN 16 112 600 281, Australian Financial Services License Number 286354.
Opinions are personal to the authors and do not reflect the opinions of LeapRate. This is not a trading advice.
[ad_2]
Source link


