

[ad_1]
U.S. Indices Technical Outlook:
- S&P 500 was crushed on CPI, showing market is still too hopeful worst is over
- Nasdaq 100 to keep leading the market on the downside
- Dow Jones levels and lines to watch in days ahead
Recommended by Paul Robinson
Check out the Q3 EQUITIES Forecast
S&P 500, Dow Jones, Nasdaq 100 Outlook: Yesterday Showed Market Still Too Optimistic
The market put in a countertrend rally prior to yesterday’s CPI number, with the market clearly looking for a lower print. The sell-off seen yesterday showed just how fragile the market is, and hopeful that the worst is behind us.
It is my view that the market is in an a prolonged bear market, and price action like this on a figure miss further validates this notion. With that said, however, we may see a near-term bounce as the SPX sits on recently proven slope support.
The line rising up off the June low held just as recently as last week. If we see a bounce develop it is anticipated to quickly fail. A breakdown beneath the line and lower-low under 3886 will have the market on its heels towards the next level of support down at 3722, which was an important low in that it was a reversal that led to a powerful move to the 200-day MA.
Beneath there the 3636 low will come into focus. If the full-on bear market thesis is correct, given where we stand in this cycle, that low should be exceeded at some point in the coming weeks. The thinking is that we may get another meaningful low sometime this fall.
To flip the script to a bullish outlook it will take a lot of work from here to get the market going again. For now, sticking with a short bias until the market indicates it may be time to turn either neutral, or even outright bullish.
S&P 500 Daily Chart

It won’t take much to get the Nasdaq 100 to the June low. It has been the leader on the downside and expected to continue being the case. It is well below the equivalent slope the S&P is sitting on, demonstrating that it is weaker overall.
The next level of support clocks in at 11928, followed by the area around 11492, then the June low at 11037. On the top-side it is going to take a move back above 12752 to get started back in a positive direction.
Nasdaq 100 Daily Chart
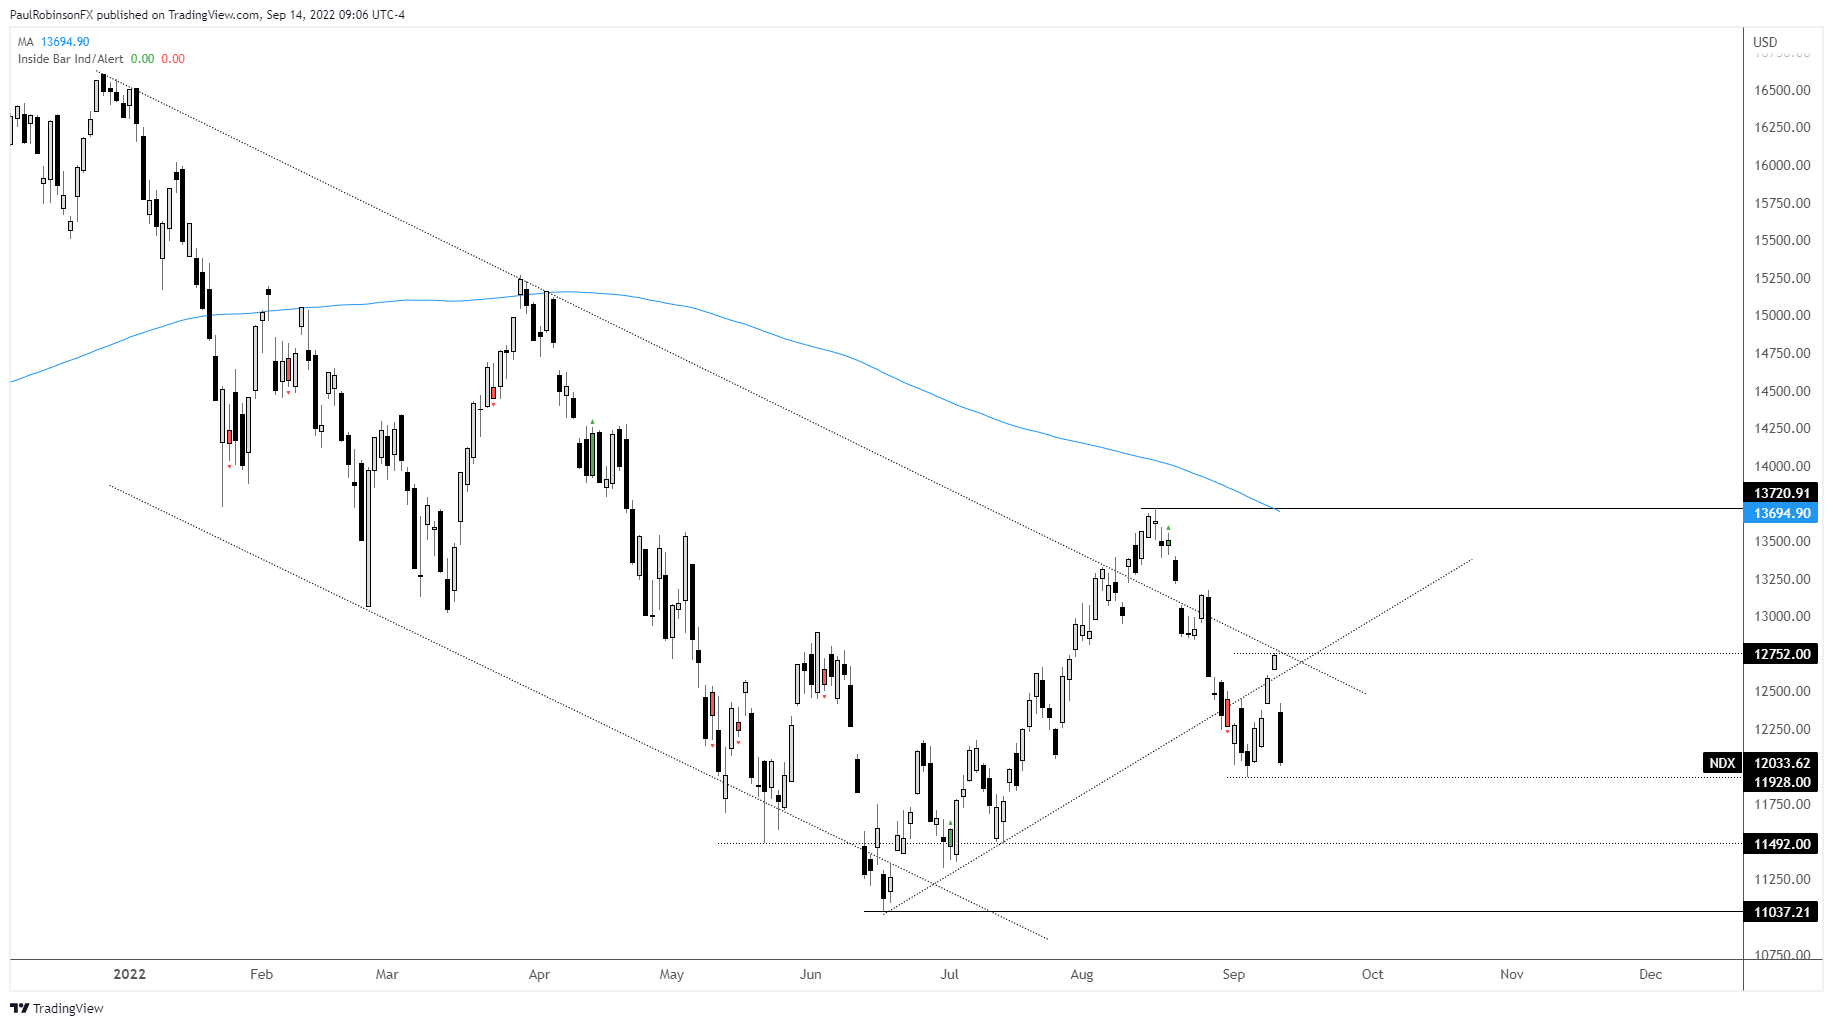
Nasdaq 100 Chart by TradingView
The Dow Jones is already at a fresh low off the August high and below the trend-line from June. We could see a bounce soon, but looking for the 30149 level to get hit relatively soon, followed by a move to the June low at 29653, and lower. On the top-side 32505 will need to be crossed to begin improving a bullish bias.
Dow Jones Daily Chart

Dow Jones Chart by TradingView
Resources for Forex Traders
Whether you are a new or experienced trader, we have several resources available to help you; indicator for tracking trader sentiment, quarterly trading forecasts, analytical and educational webinars held daily, trading guides to help you improve trading performance, and one specifically for those who are new to forex.
—Written by Paul Robinson, Market Analyst
You can follow Paul on Twitter at @PaulRobinsonFX
[ad_2]
Source link


